This is my first post of 2010. As I had said in my last post in December, this year I am focusing on money dicipline and high probability low risk trades this year. In that goal, I will be posting explanations to the trade setups I post, not just the setup and result. I have come to firmly believe and embrace that a good trader is a consistently consistent trader, which infers that there is a pattern to a good traders results. Following that through, one needs to have an arsenal of singles and doubles that work more times that not, and if not, are not game ending. This is key, being able to survive a series of bad trades without being tempted to go for the home run trade on a weak setup and ending the game (margin calling or worse). Sometimes standing aside is the best course of action. There is no stat that matters more than keeping your trading capital.
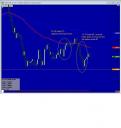
EURUSD 62 bounce 13Jan10 (click to see chart)…
This is one of my favorite trades and is easy to spot, stops are clear cut, and target goals are easy to set up. I call it the 62 bounce, and I trade this on the 1 hour time-frame chart.
Here is the trade (the pivots on the chart are the next days, but look at the notations to understand the original trade). There are two conditions that have to be met for this trade to be a valid setup. First, at a minimum there has to be a trend that was in place recently and second, that trend is confirmed by the 62 EMA and 200 SMA in phase with the trend. I also use the 144 EMA on my charts as well as the 800 SMA. For a longer term trend, the 800 SMA will also be in phase with the dominant trend, but for a shorter trade, I am o.k. with just the 62 and 200 trending together in phase.
The trade sets up when price falls to the 62 and bounces off it. That is it. The basic trade. Take the trade in the direction of the original trend. If a wick penetrates and the next candle moves back that is still a valid setup. They key is to confirm that the 62 is acting as strong resistance to price. If you look at the chart, you will see several 62 bounces that set up. All but the last one would have been able to be closed at a profit.
I also look for confirming signals as well as some basic support and resistance setups to target stops and profit targets. This is a 30 to 50 pip trade for me on this pair. If you look at the entry I chose you will see the gradual decline from a 2 bar reactionary move. Then the smaller less convicted bars just retracing the earlier movement. If you analyze the time of day you’ll also notice that the retracement happened during low volume time periods and the start and follow trough of the bounce happened at the Asian session, then took off during the Eurpoean session, and retraced in the U.S. morning session and followed through. That is another key thing I watch for, inter session give and take.
I hope this gives you a bit of insight into one of my favorite trades, but be very aware that this is a short term trade setup. Take it, get your 30-50 pips and get out. Look for reversals and test riding back to the 62 as well (I also took some pips as it reversed in the US session).
Safe trading,
Mike


